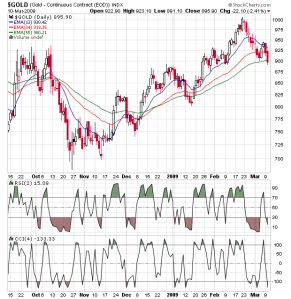
Gold is in a strong upmove starting right from near to end of october month onwards after hitting a low of $681 on 24th Oct 2008. Since then its journey towards $1000 is an explosive one. After hitting $1000 levels gold is struggling to keep it gains
and constantly loosing its gains day by day making gold investors to fear that will the trend in the gold sustains. Gold has lost nearly $100 gains or off 10% from its high.
When Applying the EMA Technical Principles to the gold daily chart(6 months) it is noted that still no major bearishness EMA crossover in the daily chart. When Applying the 13,34,55 EMA principles to the gold chart is seen that gold is nearing the highly probable support region $900 which is nothing but the current 55 EMA line where a major support is expected. Also there is no collapse or crossover between the EMA lines(13,34,55) which is an indication that still bears are not yet get spreaded in shorting the golden instrument. Short term strategy CCI-4< -100 also indicates gold at oversold levels(-133.33) and a possible bounce is very near term
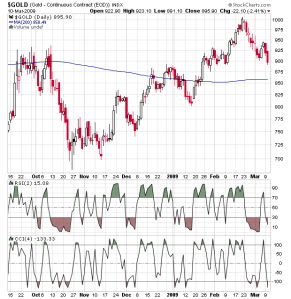
Failing to taking support near $900 levels will target gold towards the next support level of 200 day MA average $858.49 which is considered as the final support for the Bull trend in gold to continue in future.

