Menu
  • Crash Course on Orderflow
  • Training
  • Premium
  • Traders Cafe
  • Intraday signals
  • MCX Signals
  • Library

Marketcalls

Simply Intelligent Technical Analysis and Trading Strategies

  • Software
    • Amibroker
    • NinjaTrader 7
    • Ninjatrader 8
    • Option Action
    • Market Analyst
    • Metatrader
    • Python
    • Datafeed
  • Market Profile
    • Orderflow
  • Markets
  • Commodities
  • Forex
  • Economy
    • Banking
  • Webinars
  • Trading Lessons
    • Algo Trading
    • Infographic
    • Video
You are here: Home / Nifty Technicals / Nifty Swing Trade Hourly Chart

Nifty Swing Trade Hourly Chart

September 24, 2008 by Rajandran 2 Comments


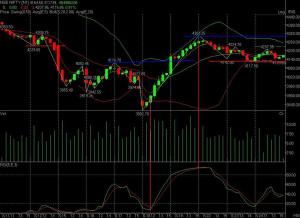
The Chart shown here is a 9 day hourly chart.
As Per this swing chart we are trending upwards only if we are able to close above
4303 and trending downwards if we are manage to trade below 4117 for couple of hours.

Upside Swing :
The previous swing high is 4207 and any trade above 4207 will target 4250 and
any trade above 4303 will target 4450.

Downside Swing :
The Current Swing Low is near 4117. Any trade below 4117 in nifty will target 4000 levels and almost no support below  4117… so even it may take to 3800 levels.

Also bollinger bands showing weaker signal as the candles closed exactly below the
20 period EMA and RSI likely to trending downwards as shown in the hourly
charts. Also as said earlier still the gap at 4090-4120 left unfilled in nifty futures which
will act as strong support
 
If you wanna learn some swing trade you can try out here
http://rajandran.googlepages.com/stratergyswing.doc
 
Happy Trading!!!!
Source:
www.marketcalls.in

Related Readings and Observations

  • Market Bits – SMS News and Stock Alert ServiceMarket Bits – SMS News and Stock Alert Service Market Bits is an Intelligent free sms based news service, whichprovides you information like Stock market news, Expert tips,opinions, global factors affecting Indian markets. Global […]
  • S&P500 and Dow Jones Index January Overview – IS&P500 and Dow Jones Index January Overview – I Currently Both the US Indices S&P500 and Dow Jones are in positional sell mode for a long time since 2nd Jan 2014. Currently the resistance zone coming around 1855 and 16543 respectively. […]
  • Reconstucting Elliot Wave Count for NiftyReconstucting Elliot Wave Count for Nifty   Nifty Breaks the resistance 2724 levels and tested 2800 levels. So Iam reconsructing the Short Term Elliot Wave Count structue. As a 5 wave structure is not possible as […]
  • Market Calls Virtual PortfolioMarket Calls Virtual Portfolio Please refer the below link for MarketCalls Investment Behaviour for Better Investment returns for the year […]
  • Metatrader to Amibroker Tick Charts using DDE universal pluginMetatrader to Amibroker Tick Charts using DDE universal plugin Here is a very simple solution to get Realtime Tick Charts in Amibroker using Metatrader DDE Server.
  • Nifty and Bank Nifty charts for 5th July 2011 tradingNifty and Bank Nifty charts for 5th July 2011 trading Nifty 90 min charts   Nifty and Bank nifty is in buy mode on 90 min charts since June 24th and currently with the supports 5575 and 11142 respectively. Also Nifty turned to […]

Filed Under: Nifty Technicals

About Rajandran

Rajandran is a Full time trader and founder of Marketcalls & Co-Founder of Traderscafe, trades mostly using discretionary Trading Concepts like Market Profile, Trading sentimental analysis, building timing models, algorithmic trading models. Instructs professional traders, full time traders & aspiring full time traders. Rajandran attended college in the Chennai where he earned a BE in Electronics and Communications. Rajandran has a broad understanding of trading softwares like Amibroker, Ninjatrader, Esignal, Metastock, Motivewave, Market Analyst(Optuma),Metatrader,Tradingivew,Python and understands individual needs of traders and investors utilizing a wide range of methodologies.

Comments

  1. manish says

    March 12, 2013 at 3:44 pm

    Sir,
    What is the RSI settings in above chart ?
    What is settings like (5,E,3).
    Sir I request you kindly told me detail about this settings,
    because I am new in technical trading.
    Thank you in advance.
    Manish

    Reply
    • Rajandran R says

      March 12, 2013 at 4:48 pm

      @Manish,

      In the above Setting RSI is 5 and EMA ( RSI(5) , 3) is applied over the RSI

      Reply

Leave a Reply Cancel reply

Your email address will not be published. Required fields are marked *

Email Newsletter

Sign up to receive email updates on latest trading strategies , analysis & financial market updates

We Respect Your Privacy

Premium Access

Username:
Password:
Remember Me
Lost your password?

Tools For Traders

  • Marketcalls Android App
  • MCX Signals
  • Intraday Signals
  • International Commodities
  • OI Tracker
  • Participation OI
  • Your Broker
  • Market Sentiment Analysis

Amibroker Updates

[Recorded Webinar] How to Send Bracket Order, Cover Order and Multiple Orders using Amibroker and AlgoAction Platform

December 25, 2018 By Rajandran 1 Comment

AlgoAction Now Supports Bracket Order and Multi Orders

December 23, 2018 By Rajandran Leave a Comment

Code Snippet : ORB – Open Range Breakout Levels – Amibroker AFL Code (Better Version)

December 4, 2018 By Rajandran 1 Comment

Button Trading in Amibroker using AlgoAction Platform

December 2, 2018 By Rajandran Leave a Comment

[Recorded Webinar] Chart Based Vs Scan/Exploration Based Automated Trading – Amibroker

December 2, 2018 By Rajandran 1 Comment

  • Facebook
  • Google+
  • LinkedIn
  • RSS
  • Twitter
  • YouTube

Metatrader Updates

MetaTrader 5 Demo Servers Now Available for BSE Currency Markets

March 20, 2018 By Rajandran 8 Comments

ChartIQ – WebTrader for MT4

December 4, 2017 By Rajandran 4 Comments

Metatrader 4 – Web Platform Overview

October 29, 2015 By Rajandran 9 Comments

William VIX FIX Indicator for Metatrader 4

May 16, 2015 By Rajandran 9 Comments

How to Install Custom MQL4 indicators in Metatrader

November 14, 2014 By Rajandran 6 Comments


About | Contact Us | Terms and Conditions | Privacy Policy | Support Policy | Privacy Policy | Refund Policy | Disclaimer


© Copyright 2018 Marketcalls Financial Services Pvt Ltd · All Rights Reserved · And Our Sitemap · All Logos & Trademark Belongs To Their Respective Owners·

Data and information is provided for informational purposes only, and is not intended for trading purposes. Neither marketcalls.in website nor any of its promoters shall be liable for any errors or delays in the content, or for any actions taken in reliance thereon.