Rajandran R Telecom Engineer turned Full-time Derivative Trader. Mostly Trading Nifty, Banknifty, USDINR and High Liquid Stock Derivatives. Trading the Markets Since 2006 onwards. Using Market Profile and Orderflow for more than a decade. Designed and published 100+ open source trading systems on various trading tools. Strongly believe that market understanding and robust trading frameworks are the key to the trading success. Writing about Markets, Trading System Design, Market Sentiment, Trading Softwares & Trading Nuances since 2007 onwards. Author of Marketcalls.in)

Bharti Airtel – Simple Trend Line Analysis

37 sec read


[wp_ad_camp_5]


Stock : Bharti Airtel Ltd
CMP : Rs 773

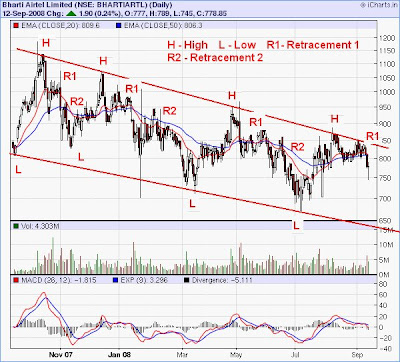
From the charts it is clearly visible that Bharti is in a strong downtrend for the past one year and it is simply repeating the pattern (H-R1-R2-L)-(H-R1-R2-L) (Where H- High, R1 – Retracement 1, R2 – Retracement 2, L – Low ) and this pattern is repeating for past three times.Means every time the stock see a new low it immdiately bounce back to a new high and whenever the stock reaches its lower high it is not immediately ready to give its gain and the stock losses its potential after few retracements.

And the retracement R1 & R2 levels provide us good oppurtunity to short the stock and whenever the stock reached new low it provide us the huge oppurtunifty to go long in this stock.If you follow the pattern you would get a
great buy around the lower trendline which comes roughly near 650(Buy for short term) and a breakout buy above the upper tredline 850(Long Term).
Rajandran R Telecom Engineer turned Full-time Derivative Trader. Mostly Trading Nifty, Banknifty, USDINR and High Liquid Stock Derivatives. Trading the Markets Since 2006 onwards. Using Market Profile and Orderflow for more than a decade. Designed and published 100+ open source trading systems on various trading tools. Strongly believe that market understanding and robust trading frameworks are the key to the trading success. Writing about Markets, Trading System Design, Market Sentiment, Trading Softwares & Trading Nuances since 2007 onwards. Author of Marketcalls.in)

Nifty and BankNifty 90 min charts update for 16th…

Nifty turns to sell mode on 90 min charts with trailing resistance coming near to the 5500. Similarly Bank Nifty too in sell mode...
Rajandran R
10 sec read

Nifty and BankNifty 90 min charts update for 15th…

Nifty turns to buy mode with cloud supports coming near to 5460-5470 zone. And Bank Nifty still in sell mode with resistance near 10900....
Rajandran R
8 sec read

Nifty Week End Review

Nifty week end review on daily and 90 min timeframe and Nifty Option Details
Rajandran R
32 sec read

Leave a Reply

Get Notifications, Alerts on Market Updates, Trading Tools, Automation & More