[wp_ad_camp_5]
Nifty CMP : 4352
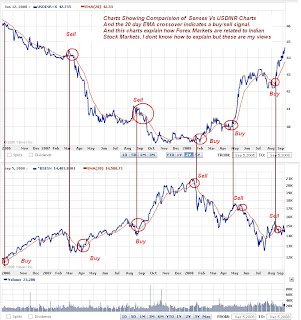
Charts Showing Comparision of Sensex Vs USDINR Charts and the 20 day EMA
Crossover indicates a buy/sell signal. And this charts explain how forex markets are
related to Indian Stock Markets. I don't know how to explain since i was novice to
forex markets. And the chart says that whenever a buy signal generated in rupee
there is a corresponding sell signal in Sensex. But i think the chart explanations
is quite easy to understand where we are moving.
Inference from Three Year Charts
And from the charts we clearly see that during February,2007 our rupee trade nearly
at 44.5/Dollar what we exactly trade now. Buy that time sensex trading around 14,500
what exactly we trade now in sensex
And still the Charts shows a buy signal in rupee.. means it could extend
upto Rs46/Dollar.
And again from charts we cleary see that during october 2008 our rupee trade nearly
at 46/Dollar . And Buy that time sensex trade at 11000 and odd pts.
This is What gonna happen now…. And the fundamentalist people go and search
what is going to be fundamentally wrong… Coz everything technically going right.
