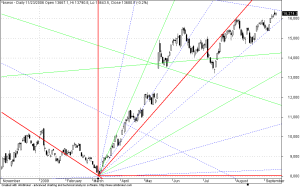
I think no much explainations needed to Descibe this. Just the GANN FAN lines are drawn between
major and much important Highs and Lows. And the lines indicate Resistance and Support Levels
In GANN Chart 1 – Lines are drawn between Oct 2001 Bear Market Low to JAN 2008 Bull Market High
In GANN Chart 2 – Lines are drawn between JAN 2008 Bull Market High to Mar 2009 Bear Market Low
In GANN Chart 3 – Lines are drawn between Mar 2009 Bear Market Low to AUG 2009 Major High
In All the Charts GANN Fan Lines forming the Major and Perfect Support and Resistance Zone… Which could be
even seen visibly.. and it doesnt needs harder explainations.
For Example From GANN Chart 3 we could see that 16450 is acting as a strong resistance as of now
which is nothing but the entire retracement of Jan 2008 Bull Market high to March 2009 Bear Market low.
as shown in Chart 2 also.


Dear rajthanks for the gann update it has been extremely useful. As per the second gann chart sensex has gone above 16450 and is staying above it for the third consiquetive day and it indicates strength. And as per the second chart it appers that the next resistance as pre gann chart is around 20000 only. as per all the three charts it appears that the next gann resistance is only at 20000. am i correct pls comment.M.Sri Mahidar