Rajandran R FollowCreator of OpenAlgo - OpenSource Algo Trading framework for Indian Traders. Telecom Engineer turned Full-time Derivative Trader. Mostly Trading Nifty, Banknifty, High Liquid Stock Derivatives. Trading the Markets Since 2006 onwards. Using Market Profile and Orderflow for more than a decade. Designed and published 100+ open source trading systems on various trading tools. Strongly believe that market understanding and robust trading frameworks are the key to the trading success. Building Algo Platforms, Writing about Markets, Trading System Design, Market Sentiment, Trading Softwares & Trading Nuances since 2007 onwards. Author of Marketcalls.in
Nifty Weekly 5 EMA Strategy
9 sec read
[wp_ad_camp_5]
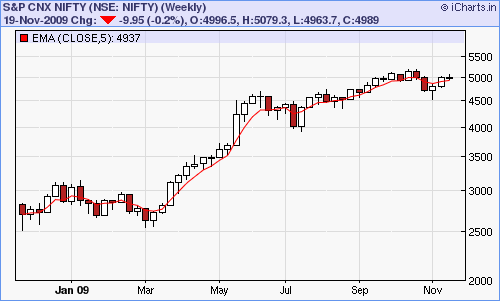
As Trading Week is likely to end its good to look at weekly 5 EMA charts Weekly 5 EMA chart points to the support zone of 4937. Nifty could give a fresh weekly sell signal if nifty closes below 4937
Related
Rajandran R FollowCreator of OpenAlgo - OpenSource Algo Trading framework for Indian Traders. Telecom Engineer turned Full-time Derivative Trader. Mostly Trading Nifty, Banknifty, High Liquid Stock Derivatives. Trading the Markets Since 2006 onwards. Using Market Profile and Orderflow for more than a decade. Designed and published 100+ open source trading systems on various trading tools. Strongly believe that market understanding and robust trading frameworks are the key to the trading success. Building Algo Platforms, Writing about Markets, Trading System Design, Market Sentiment, Trading Softwares & Trading Nuances since 2007 onwards. Author of Marketcalls.in
Please can you explain how to read Nifty open intrest option data,(wot it indicates for this month closing) question also raised @ VFM forum