[wp_ad_camp_5]
NMA(Nick Moving Average) alias NRTR(Nick Rypock Trailing Reverse Trading system) uses Heikin-Ashi Technique.
Heikin-Ashi is a type of candlestick chart that shares many characteristics with standard
candlestick charts, but differs because of the values used to create each bar. Instead of
using the open-high-low-close (OHLC) bars like standard candlestick charts, the Heikin-Ashi
technique uses a modified formula:
Close = (Open+High+Low+Close)/4
Open = [Open (previous bar) + Close (previous bar)]/2
High = Max (High,Open,Close)
Low = Min (Low,Open, Close)
The above formula can be achieved by the following afl code
HACLOSE=(O+H+L+C)/4;
HaOpen = AMA( Ref( HaClose, -1 ), 0.5 );
HaHigh = Max( H, Max( HaClose, HaOpen ) );
HaLow = Min( L, Min( HaClose, HaOpen ) );
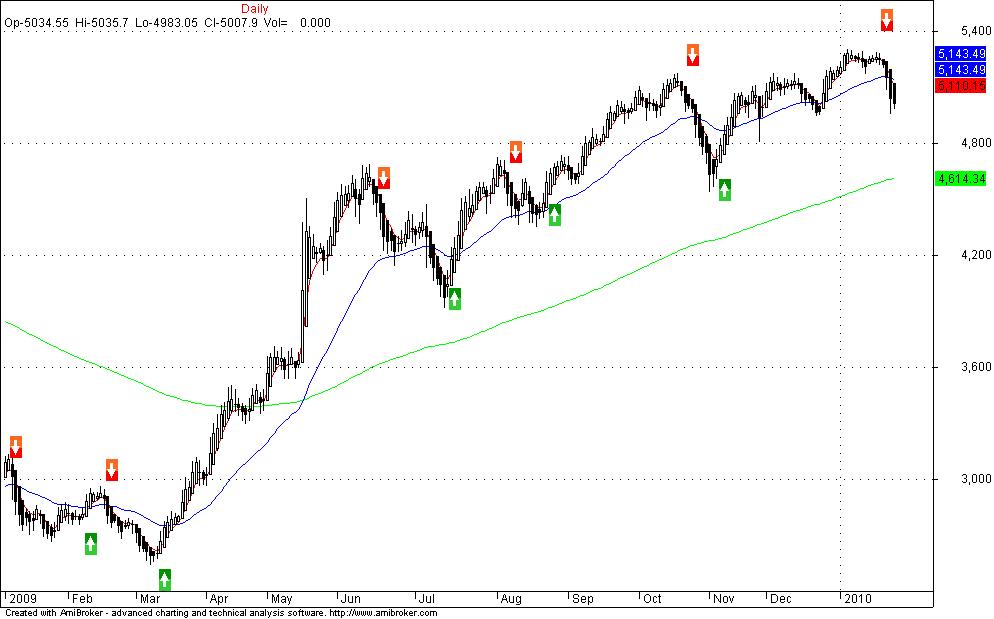
Chart for Nifty NMA Daily charts shown above
You are verymuch inovative in exploring ideas and relenlessly sharing ur knowledge with lay people like me. It helps us to understand the intricacies in a simple manner. You are simply fabulous. I am one of your fan and silent student.In the NMA chart above are two lines (blue and green). I could not know if they are reprenting MAs? I will be highly obliged if can elaboratr how thr up and down arrows are drawn or calculated.thanks and best regards.Vivek
Yeah the blue and green line represents only the moving averages 8 EMA and 34 EMA. Its just used for identifying support/Resistance. But it doesnt play any role in Buy/Sell Signal
rajandran,
can u provide afl for this ..
tks n rgds
sri
Nick Rypock Trailing Reverse Trading system You can get here
Where can I go to see this indicator on the QQQQ chart? Nick Rypock Trailing Reverse Trading system?
Thx
John
Hi I am using Ichimoku Cloud strategy with Chartnexus EOD version.I was using paid EOD software before this now it will save me the cost.I have recommended this software and your site to my friends and they are happy and amazed with the reading material available on this site.I commend u r efforts and time taken to make these things available freely.
Thanks Kiran!