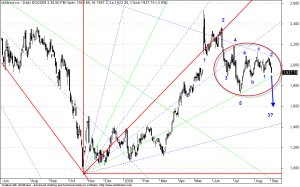
By Constucting GANN FAN lines for Reliance ,probably we could understand the nature of
the movement in that stock. The GANN FAN line is applied to the indicator as shows in the
first chart.
The Most intresting part comes when zoom into May 2009-SEP2009 period. The Zoomed
part is shown in Chart-2. From the chart 2 we could understand that Since June 2009 Reliance
Started Oscillating between major GANN Resistance/Support line which is highligted with a red
circle. Also we could understance the formation of Invesrse 5-3 Ideal Elliot Pattern in Reliance as
shown. And if we speculate the wave formation to be 5-3-5 Pattern (Sub for of ABC corrective
Pattern) then next stop for reliance comes around 1600. GANN Resistance Comes near 2080 and
GANN Support comes near 1880.
Reliance is expected to oscillate between 1880-2080. And the trend is exected to be on the downside
towards 1600. The total analysis is validated to be wrong if reliance trades above 2080. Moreover Reliance
likely to be the trend decider for Nifty. As Reliance lags Nifty sicne May 2009 after hitting historical circuit
the performance of nifty is expected to detoriate with respect to time.
Regards,
Rajandran R


Dear Rajandran Can we go short in reliance @ 2040-2050 lvls with a sl of 2080 on monday.