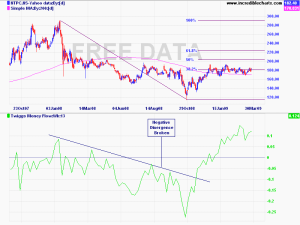
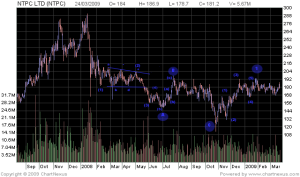
NTPC is one among the stock trading above 200day Moving Average(pink line). Technically a stock trading above 200day Moving average is considered as a bullish signal for Long Term. Also NTPC has broken the Negative Divergence formation in 13 Week Twigg's Moeny Flow indicator during mid of Nov 2008 just like nifty as explained in Twigg's Breaks Long Term Resistance
After Few Downturns It started its major move towards 200 day Moving average(Rs 170) during mid of Dec 2008 and till to the date NTPC maitains its bullish status.. ie hanging above the bullish line 200day Moving average and also consolidation above the 200day Moving average line. Which shows the medium term to long term outlook of the stock looks bullish with targets of 200 and 220 which is nothing but the 50% and 61.8% fibonacci retracment from the lows as shown in charts.
Those who are bullish in power sector can accumulate this stock for investment purpose with less risk appetite at this point of time for 25-30% gains.

