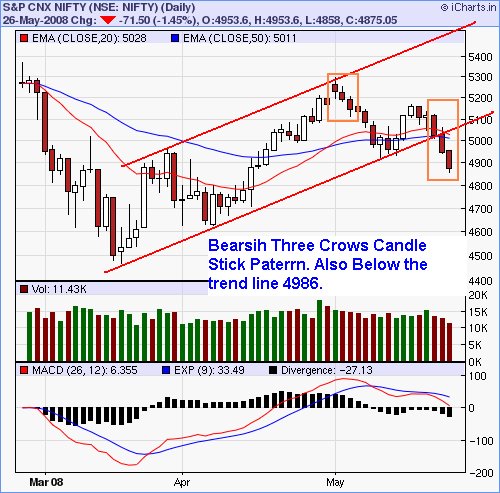
Nifty Spot Price : 4875
Candle Stick Patten Formed : Three Black Crows
Indicate : Bearish
[wp_ad_camp_5]
Bearsih Three Black Crows pattern this what all the financial blogs and Analyst are shouting which we witness in yesterdays nifty
charts(see fig for ref). And Iam the last one to shout about this pattern.
What Does a Three Black rows Pattern Mean?
Following an uptrend, three long red days with consecutively lower closes act as a strong indicator, certainly the very definition of a downtrend, and almost assuring future bearish trends.
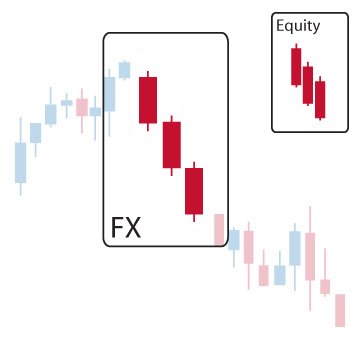
The Bearish Three Black Crows serves as a clear and rather obvious signal of pause in the bullish move. Although one strong bearish candle can be reasonably expected during a bull trend, the second and third days suggest profit taking and consolidation of the bull trend.
Candlestick traders will watch for more bearish or ranging markets to come, but if the candles are too overextended analysts will worry that the market may now be oversold and pause accordingly.
Are we in a Clear downtrend?

Hardly, Yes. When Nifty breaks the trend line below 4986 we are clear that we are moving towards the downtrend. And More and more
confirming technical signals are changing to bullish to bearsih day by day. The Down Channel has opened in nifty.
Conclusion
So what we can expect from todays market. This day may trade in quite green with resistance hardly remain at 4925 .But target of upto 4780 levels being 61.8% fibonacci retracement level and It is hardly confirmed and recommeded in cheema's blog Learn and Teach Stocks . As most of the asian markets are trading in green we can expect a bouce back upto the resistant level 4913. So those people those who are bearsih are recommended to take Nifty June Puts at higher levels.
Also Yen is currently trading at 103.3/Dollar with has support at 102.75 and FII’s are the net sellers in past five sessions
Any broke ot above 4950 is considered to be a bullish signal as for as now. Till then we are to see a clear down trend in near term future.