Nifty : 3818.3
Inference from Weekly Charts
Charts Shown here is a 3 year Weekly Charts. As per this chart 200 day EMA act as a long term support
And as of now we are in the levels just below 200 day EMA and the chart looks serious correction are left still.
To be bullish in case of long term nifty should not close below 4000 by this week I guess bulls to work very hard
for this month and will try to recover 4000.Any failure for the bulls to close above 4000 will lead to a serious damage.
Stay away from value investing if we are not able to close above 4000 by this week
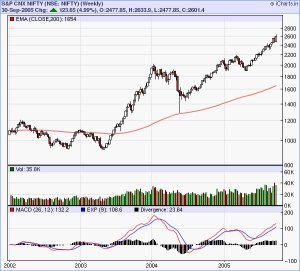
Hisotrical Weekly Charts
The Chart shown above is a historical chart between 2002-2005 and there is a
clear info from the 200 day weekly EMA(red line) that one can identify the
bull market if we are manage to close above 200 day weekly EMA
Inference from Incredible Charts
Sensex : 12526
The Sensex is testing support at 12500. Twiggs Money Flow decline below zero would signal rising selling pressure.
The primary trend is down and failure of 12500 would warn of another primary down-swing, with a target of 10000.
Happy Trading!!!

