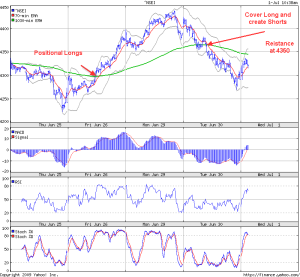
Current Position : Short
Resistance Near : 4340-4350 levels
USED Moving Average Crossovers : 1030min EMA & 70 min EMA
Charts Used : 5 day Charts, 5 min Bars
Go Long Rules
If The faster line (red ) goes above the green – > Close shorts & immediately go long.
Go Short Rules
The faster line (red ) goes below the green – > Close longs & immediately go short.
No other Indicators Needed… Works Well Especially in Volatile Times
Stop Loss
An initial acceptable range for the stop depending on your comfort level can be put. As the Nifty moves in your direction , immediately put the the stop at the purchase price + brokerage as soon as possible.
To Get these charts live with Zero minute delay visit http://nsetracker.blogspot.com
Related Readings
Nifty Positional Longs/Shorts Charts – 17 Nov 2008
Nifty Positional Shorts based on 70/1030 EMA Strategy – 19 June 2009

Hi Raj,It seems that yahoo finance chart candles are of 4mins each and not 5mins. I crosschecked with GCI Trading software(it gives live nifty future rates).Now, the ques is, does it really matter if we use 5min or 4min graph?RegardsYogesh Tiwari