Menu
  • Option Hydra
  • Training
  • Premium
  • Courses
  • Library

Marketcalls

Simply Intelligent Technical Analysis and Trading Strategies

  • Software
    • Amibroker
    • NinjaTrader 7
    • Ninjatrader 8
    • Option Action
    • Market Analyst
    • Metatrader
    • Python
    • Datafeed
  • Market Profile
    • Orderflow
  • Markets
  • Commodities
  • Forex
  • Economy
    • Banking
  • Webinars
  • Trading Lessons
    • Algo Trading
    • Infographic
    • Video
You are here: Home / Nifty Technicals / Nifty hourly charts for 12th Oct 2010

Nifty hourly charts for 12th Oct 2010

October 12, 2010 by Rajandran 2 Comments


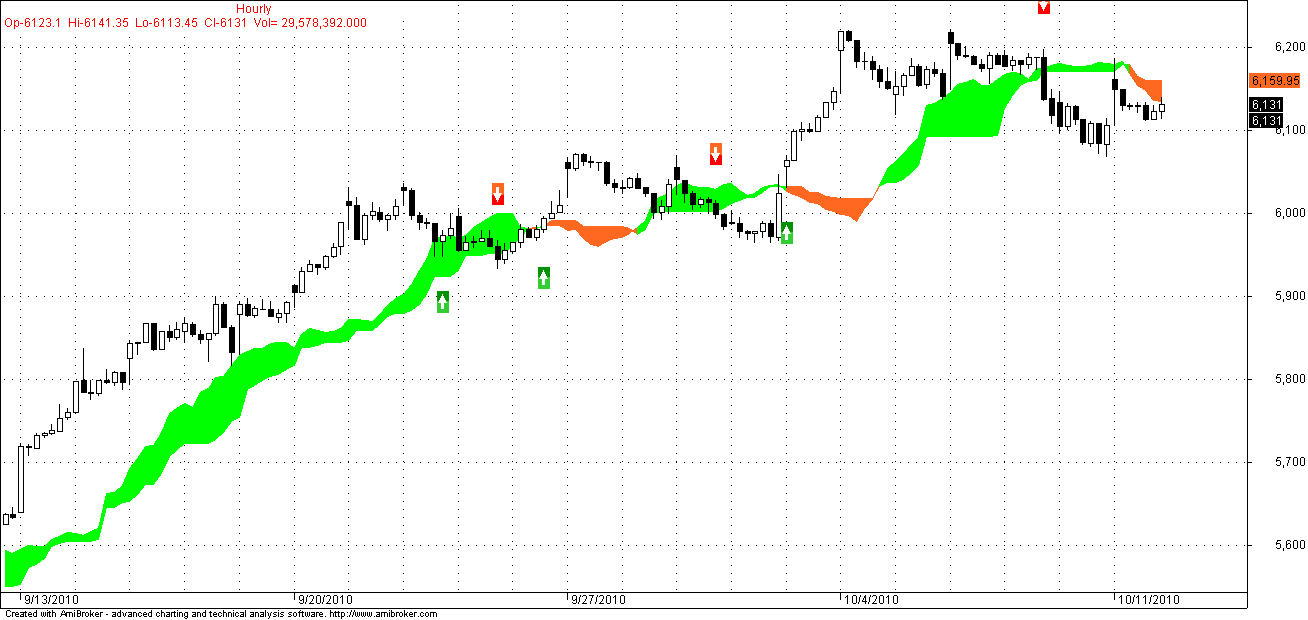
Hourly Ichimoku charts of nifty maintains the sell mode for the third continuous day with hourly cloud resistance near 6159.
Wait for the Buy Signal to trade long(i.e a hourly close above 6159).

Related Readings and Observations

  • Nifty and Bank Nifty 90 min charts for 24 April 2012 TradingNifty and Bank Nifty 90 min charts for 24 April 2012 Trading Nifty and Bank Nifty 90 min charts turned to sell mode today on the 90 min charts with resistance coming near 5290 and 10492 respectively.
  • 10 Years of Historical Nifty Weekly Ichimoku Charts10 Years of Historical Nifty Weekly Ichimoku Charts 10 Years of Historical Nifty Weekly Ichimoku Charts are shown. Currently on the long term i.e on weekly timeframe nifty is in sell mode and currently trading very close to the ichimoku […]
  • Ichimoku Cloud Charts turned to Sell ModeIchimoku Cloud Charts turned to Sell Mode Nifty Ichimoku Cloud yields a sell signal in nifty after closing below the cloud value 6007. The last Buy signal since 1st September 2010 had lasted nearly 38 trading session. And now the […]
  • Nifty Hourly Trading for 15 Oct 2010Nifty Hourly Trading for 15 Oct 2010 Nifty remains in hourly buy signal with a trailing cloud stop loss of 6127
  • Nifty Hourly Trading for 14 Oct 2010Nifty Hourly Trading for 14 Oct 2010 Nifty's 4day of hourly sell signal in ichimoku cloud turns to buy signal during the initial first hour of the day's startup. Nifty crossed above the hourly ichimoku resistance zone and […]
  • Nifty Hourly turns to sell modeNifty Hourly turns to sell mode Nifty hourly charts turns into sell mode after breaking the cloud support zone 6170. Now Nifty shorterterm trend is focused towards Selling Bias with 6170 as trailing stop loss line

Filed Under: Nifty Technicals Tagged With: Ichimoku Cloud, Nifty

About Rajandran

Rajandran is a Full time trader and founder of Marketcalls & Co-Founder of Traderscafe, trades mostly using discretionary Trading Concepts like Market Profile, Trading sentimental analysis, building timing models, algorithmic trading models. Instructs professional traders, full time traders & aspiring full time traders. Rajandran attended college in the Chennai where he earned a BE in Electronics and Communications. Rajandran has a broad understanding of trading softwares like Amibroker, Ninjatrader, Esignal, Metastock, Motivewave, Market Analyst(Optuma),Metatrader,Tradingivew,Python and understands individual needs of traders and investors utilizing a wide range of methodologies.

Comments

  1. jitin says

    October 12, 2010 at 2:11 pm

    sir ,
    how to get eod data of dow on ami to check with nma .tx

    Reply
  2. Rajandran R says

    October 12, 2010 at 2:44 pm

    Try yahoo finance historical data and download the CSV

    Reply

Leave a Reply Cancel reply

Your email address will not be published. Required fields are marked *

Email Newsletter

Sign up to receive email updates on latest trading strategies , analysis & financial market updates

We Respect Your Privacy

Premium Access

Username:
Password:
Remember Me
Lost your password?

Tools For Traders

  • Marketcalls Android App
  • MCX Signals
  • Intraday Signals
  • International Commodities
  • OI Tracker
  • Participation OI
  • Your Broker
  • Market Sentiment Analysis

Amibroker Updates

Volatile Phases – Colorful ADX Amibroker AFL Code

November 16, 2019 By Rajandran 4 Comments

Amibroker Technical Analysis Workshop – Bangalore

November 1, 2019 By Rajandran 2 Comments

How to Send Alerts from Amibroker to Telegram Channel using Telgram API

June 12, 2019 By Rajandran 15 Comments

How to Estimate the VWAP based settlement Close like a Pro using Amibroker?

June 9, 2019 By Rajandran Leave a Comment

Practical Approach to Amibroker AFL Coding

May 23, 2019 By Rajandran 37 Comments

  • Facebook
  • Google+
  • LinkedIn
  • RSS
  • Twitter
  • YouTube

Metatrader Updates

MetaTrader 5 Demo Servers Now Available for BSE Currency Markets

March 20, 2018 By Rajandran 8 Comments

ChartIQ – WebTrader for MT4

December 4, 2017 By Rajandran 5 Comments

Metatrader 4 – Web Platform Overview

October 29, 2015 By Rajandran 9 Comments

William VIX FIX Indicator for Metatrader 4

May 16, 2015 By Rajandran 9 Comments

How to Install Custom MQL4 indicators in Metatrader

November 14, 2014 By Rajandran 7 Comments


About | Contact Us | Terms and Conditions | Privacy Policy | Support Policy | Privacy Policy | Refund Policy | Disclaimer


© Copyright 2018 Marketcalls Financial Services Pvt Ltd · All Rights Reserved · And Our Sitemap · All Logos & Trademark Belongs To Their Respective Owners·

Data and information is provided for informational purposes only, and is not intended for trading purposes. Neither marketcalls.in website nor any of its promoters shall be liable for any errors or delays in the content, or for any actions taken in reliance thereon.