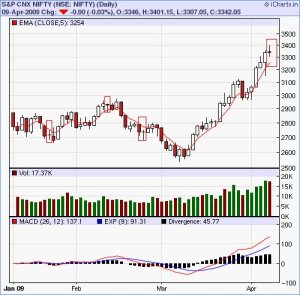
Nifty Daily Charts chart shows that whenever Doji's are formed in nifty its good to apply the 5 EMA rule to nifty daily charts.
Whenever doji's are formed in nifty with a huge difference between the nifty closing and 5 EMA then possibly trend reversal could happen or a sideways movement can continue till the candle touches 5 EMA line. Because it is already proved that 5 EMA
act as a gravitational field in my previous post What could be the reason for Consolidation in Nifty?
Currently there is a huge gap i,e (3342-3254= 92 pts) between nifty closing(3342) and 5 EMA(3254). so two types of patterns are possible
1)Either monday Nifty should directly test the 3254 levels to meet 5 EMA line even if nifty opens gap up…..
2)Nifty should consolidate for one or two days around 3300 levels so that 5 EMA line will move towards the candle
So how a trade could be intiated at this level on monday?
1) If there is a gap up opening then then there is a good chance to short this market… coz a gap up opening will once again widen the gap between the 5EMA and the candle closing which provides us a good shorting oppurtunity
2) Also there is formation of Negative Momentum divergence in nifty hourly charts
shows that trend reversal could happen any time soon.
So a gap up opening in nifty is a good oppurtunity to shorters this monday for a target of 3300 and 3250. Also RSI-2(96.26) and CCI-4(185.6) indicate heavily overbought levels.

sir, your analysis is great . i am a regular reader of your analysis. it is very helpful in understanding the market.its my first comment. thanks. hitesh dhamecha email; [email protected]
Thanks hitesh anyhow trade Pattern Failed