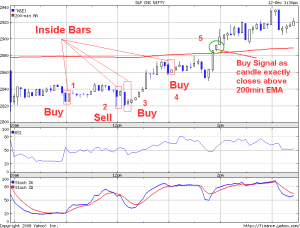
Though it is a tough day for me with my nifty positional shorts.
Few signals i noted today. But i was simply rejecting those positive
signals. As i decided to keep my stoploss near 200min EMA(2880).
I was completely beaten down finally when nifty hits 2800 and surges above that
But here are those intresting signals..
Inside Bars are the most commnly signal i often found in 5 min intraday nifty charts.
Simply to say about Inside candle
1)First candle is a long candle
2)Second candle falls between the high and low of the first candle… i.e Second candle's
is been covered by the body of the fist candle
3) Then if the third candle closed above the second candle then it is a buy. And if
the third candle closed below the second candle then is a clear short term sell.
And the second thing is as usual the 200min EMA
1) If the candle closed above 200min EMA it is a clear Buy
2) If the candle closed below 200min EMA it is a clear sell
My Observation while trading
1)The First Inside Bar occured during 11.AM… But simply i was keep ignoring
the signals and waiting for the IIP no's(Which should be 100% bad).But Inside bar is giving Buy signals as the third candle closed above the second candle of
inside bar
2)The Second Inside Bar formed occrured during 12P.M exactly where the -ve IIP no's
arrived. And this time there was a Sell Signal from the Inside Bar… And Iam little
bit proud of myself that market is anyway going to tumble with the bad IIP no's. Also
Asia is in a deep red by that time
3&4)The Next comes the Shock to me at 12:15P.M and 1.00P.M ..as The Third red candle is followed by a small indecesive villan candle… Yup Once again Inside Bar with Buy Signal and the next prceding candle move upwards. But anyhow once again i was ignorning the Positive signals and now this time waiting for European markets to open. Simply Believing on Outside on Completely Independent market….rather than believing on Nifty candles. Jesus the 3rd and 4th Inside Bar is a buy signal
5)But i feel little bit happy as 200min MA(2880) offers little bit resistance for some amount of time and clearly now nifty is facing resistance near 200min MA(2880). Though for a long time nifty is struggling in facing resistance near 200min MA. Though Europen markets open weaker as expected our nifty started moving towards 200min MA and breaches.

i m tracking nifty options performance on ur charts. if u have back tested can u tell me how effective it is and whch time frame?
how to calculate (high-low)>=x% , where where x is 0.002,in ami broker using afl code …
immediate reply will be appreciated…