Next to RSI-2 My eyes are always around CCI-4 Strategy.
Unfamiliar with the CCI? Read this StockCharts.com primer. In a nutshell, CCI looks at how far an asset has diverged from its moving average relative to how far it “normally” divergences. CCI usually oscillates between +/-100, but will exceed those levels when the market makes a significant move.
Strategy rules: go long at today’s close when the 4-day CCI closes below -100 and exit that position when the 4-day CCI closes above 0. go short at today's close when the 4-day CCI closes above +100 and exit that position whent the 4-day CCI closes below 0
For More information about this strategy visit MarketSci
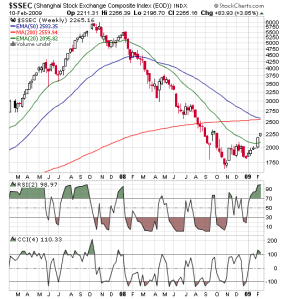
Weekly Shangai Composite Index-China
[wp_ad_camp_5]
Weekly Charts of Chinese Markets and Indian Markets shows overheated markets as Weekly CCI-4 is above 100. Also Weekly
RSI-2 of chinese market is at 98.2 shows extremety overbought markets.
Even Weekly charts of CCI-4 is above 100 shows that the rubber band of the Indian Market is getting overstreched. Possibly a Bear Trap for both chinese and Indian Markets.
