Simply Applied the concept of Bull and Bear Market Primary trend cycles what i learned from incredible charts. Check it
out.
Bull-Bear Market Primary Trend Cycle

Image Extracted from Incredible Charts
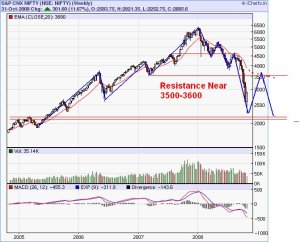
Nifty Four Years Weekly Charts
3200 where 20 day EMA resistance comes as per daily charts
But 3500-3600 is the region where 20 Week EMA resistance is
expected to come.Currently it is above 3800+….
Chance of Nifty to merge the 20week EMA… which is expected
to meet near 3500-3600 region over the time
Info from Mr AmitBhai
Fibonacci Weekly Charts for Nifty as on 26th OCT 2008
http://rajandran.googlepages.com/Nifty_Weekly_Chart_24th_Oct_08.pdf
This is nifty weekly chart 2950 was the last hope which is .618% but that is also broken. Now next level is 2458
and if broken then 2024 is the last level.
As per super cycle nifty is making wave 2 and then .786 is the target.
so u can understand what will be market conditions.

