Rajandran R FollowFounder of Marketcalls and Co-Founder Algomojo. Full-Time Derivative Trader. Expert in Designing Trading Systems (Amibroker, Ninjatrader, Metatrader, Python, Pinescript). Trading the markets since 2006. Mentoring Traders on Trading System Designing, Market Profile, Orderflow and Trade Automation.
Nifty Intraday Notes Using 5 EMA + 2 Period RSI
32 sec read
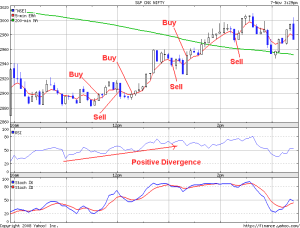
It is a multiple trading strategy in especially in nifty to trade each trend and 5 EMA,Price Closing of the candle,
And 2 period RSI is used to make decisions for your intraday trades. As per 2 period RSI —- 5 indicates overbought
levels and 95 indicates oversold levels which play a considerable role in making decisions. Check out the charts
for making confirm decisions.
Above Nifty Chart Shows Buy/Sell Signals Buy means Buy or Exit Shorts . Sell Means Short or Exit Longs
Enter Long – Exit Short Strategy
If Price Closes above 5 EMA then Enter long or Exit Short
Enter Short – Exit Short Strategy
If price Closes below 5 EMA then Enter Short or Exit Longs
For Intraday :
Use 5 min-EMA or 15 Min Charts …. Use Above rules for your entry and exit
Note : Buy/Sell Decision Should be taken only on closing of the candle
Rajandran R FollowFounder of Marketcalls and Co-Founder Algomojo. Full-Time Derivative Trader. Expert in Designing Trading Systems (Amibroker, Ninjatrader, Metatrader, Python, Pinescript). Trading the markets since 2006. Mentoring Traders on Trading System Designing, Market Profile, Orderflow and Trade Automation.
Nifty turns to buy mode with cloud supports coming near to 5460-5470 zone. And Bank Nifty still in sell mode with resistance near 10900....
3 Replies to “Nifty Intraday Notes Using 5 EMA + 2 Period…”
i would like to know how the 2 period RSI is used to make or confirm decision for buying or selling in your example ? Thank You.
Thats a pretty old strategy no more working in this matured market.
If 2 period rsi is outdated, Then what would you prefer for nifty futures trading and the how many minutes candel stick chart is better for interday trading.