Rajandran R Creator of OpenAlgo - OpenSource Algo Trading framework for Indian Traders. Telecom Engineer turned Full-time Derivative Trader. Mostly Trading Nifty, Banknifty, High Liquid Stock Derivatives. Trading the Markets Since 2006 onwards. Using Market Profile and Orderflow for more than a decade. Designed and published 100+ open source trading systems on various trading tools. Strongly believe that market understanding and robust trading frameworks are the key to the trading success. Building Algo Platforms, Writing about Markets, Trading System Design, Market Sentiment, Trading Softwares & Trading Nuances since 2007 onwards. Author of Marketcalls.in

Nifty Hourly Gann Fan Charts

1 min read


[wp_ad_camp_5]


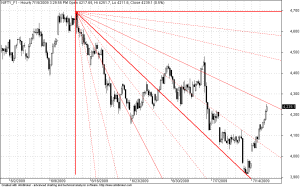
Lines of Gann Fan are built at different angles from an important base or peak at the price chart. The trend line of 1х1 was considered by Gann the most important. If the price curve is located above this line, it is the indication of the bull market, if it is below this line it is that of the bear market. Gann thought that the ray of 1×1 is a powerful support line when the trend is ascending, and he considered the breaking this line as an important turn signal. Gann emphasized the following nine basic angles, the angle of 1×1 being the most important of all:

1х8 — 82.5 degree

1х4 — 75 degree

1х3 — 71.25 degree

1х2 — 63.75 degree

1х1 — 45 degree

2х1 — 26.25 degree

3х1 — 18.75 degree

4х1 — 15 degree

8х1 — 7.5 degree

 
The considered ratios of price and time increments to have corresponding angles of slope in degrees, X and Y axes must have the same scales. It means that a unit interval on X axis (i.e., hour, day, week, month) must correspond with the unit interval on Y axis. The simplest method of chart calibration consists in checking the angle of slope of the ray of 1х1: it must make 45 degrees.

Gann noted that each of the above-listed rays can serve as support or resistance depending on the price trend direction. For example, ray of 1×1 is usually the most important support line when the trend is ascending. If prices fall below 1х1 line, it means the trend turns. According to Gann, prices should then sink down to the next trend line (in this case, it is the ray of 2х1). In other words, if one of rays is broken, the price consolidation should be expected to occur near the next ray.

 
Simply to interpret Gann Fan Lines will act as Support/Resistance
 
 
Rajandran R Creator of OpenAlgo - OpenSource Algo Trading framework for Indian Traders. Telecom Engineer turned Full-time Derivative Trader. Mostly Trading Nifty, Banknifty, High Liquid Stock Derivatives. Trading the Markets Since 2006 onwards. Using Market Profile and Orderflow for more than a decade. Designed and published 100+ open source trading systems on various trading tools. Strongly believe that market understanding and robust trading frameworks are the key to the trading success. Building Algo Platforms, Writing about Markets, Trading System Design, Market Sentiment, Trading Softwares & Trading Nuances since 2007 onwards. Author of Marketcalls.in

Nifty and BankNifty 90 min charts update for 16th…

Nifty turns to sell mode on 90 min charts with trailing resistance coming near to the 5500. Similarly Bank Nifty too in sell mode...
Rajandran R
10 sec read

Nifty and BankNifty 90 min charts update for 15th…

Nifty turns to buy mode with cloud supports coming near to 5460-5470 zone. And Bank Nifty still in sell mode with resistance near 10900....
Rajandran R
8 sec read

Nifty Week End Review

Nifty week end review on daily and 90 min timeframe and Nifty Option Details
Rajandran R
32 sec read

Leave a Reply

Get Notifications, Alerts on Market Updates, Trading Tools, Automation & More