Rajandran R FollowCreator of OpenAlgo - OpenSource Algo Trading framework for Indian Traders. Telecom Engineer turned Full-time Derivative Trader. Mostly Trading Nifty, Banknifty, High Liquid Stock Derivatives. Trading the Markets Since 2006 onwards. Using Market Profile and Orderflow for more than a decade. Designed and published 100+ open source trading systems on various trading tools. Strongly believe that market understanding and robust trading frameworks are the key to the trading success. Building Algo Platforms, Writing about Markets, Trading System Design, Market Sentiment, Trading Softwares & Trading Nuances since 2007 onwards. Author of Marketcalls.in
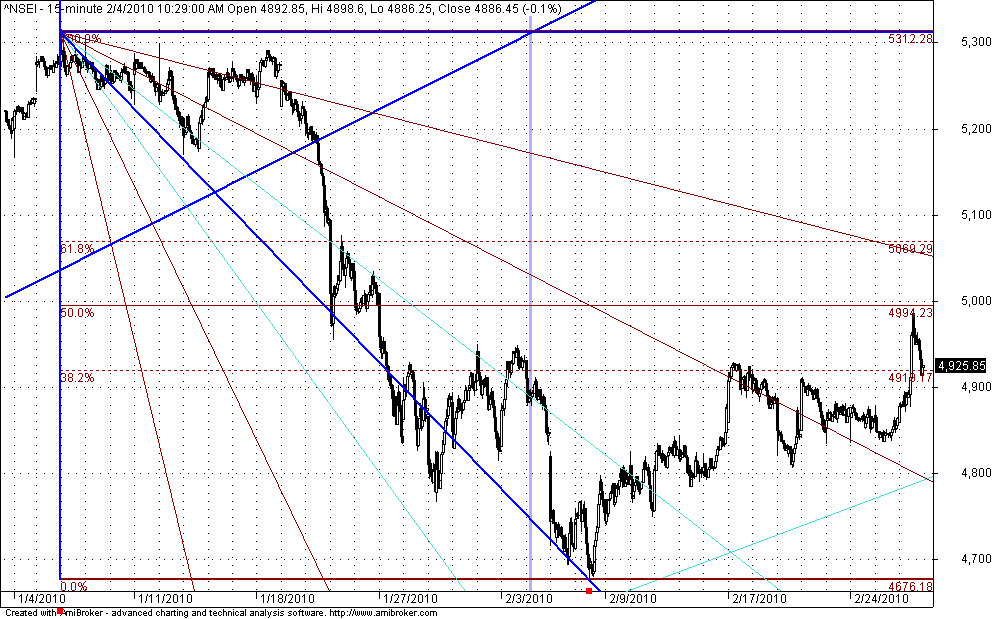
Next Resistance near 5020-5040?
12 sec read
[wp_ad_camp_5]
Chart shown is the Shorter term GANN Chart which shows that next shorter term GANN lines are near 5020-5040 levels. Fibonnaci retracment levels 38.2%, 50%, 61.2% are shown in the chart(Brown Lines). Just check out how market respect those zones. And still the long term supports are resting near 4800 levels and will increase with respect to time
Related
Rajandran R FollowCreator of OpenAlgo - OpenSource Algo Trading framework for Indian Traders. Telecom Engineer turned Full-time Derivative Trader. Mostly Trading Nifty, Banknifty, High Liquid Stock Derivatives. Trading the Markets Since 2006 onwards. Using Market Profile and Orderflow for more than a decade. Designed and published 100+ open source trading systems on various trading tools. Strongly believe that market understanding and robust trading frameworks are the key to the trading success. Building Algo Platforms, Writing about Markets, Trading System Design, Market Sentiment, Trading Softwares & Trading Nuances since 2007 onwards. Author of Marketcalls.in
The Nifty Futures October series is witnessing a consistent influx of short-term sellers on a daily basis. Over the past four consecutive trading sessions,...
The retail digital rupee will be introduced on December 1 as part of a pilot programme, the Reserve Bank of India (RBI) stated in...
4 Replies to “Next Resistance near 5020-5040?”
Sir,
How to check whether the gann fan drawn by us is correct or not…is it necessary that the 45 degree should be the diagonal of the gann squarE.
Thank you in advance.
prabha
raj,
can you post the long term gann charts…..
yeah will post it today
Prabha,
I draw the GANN Charts either connecting the major high’s and low’s(Both Shorter term and long term) and with respect to time iam once again shifting the same lines to lows to major Support or from High’s to major resistance. By doing so most of the time iam able to find interesting supports/Resistance…. Just have a try it would be fun