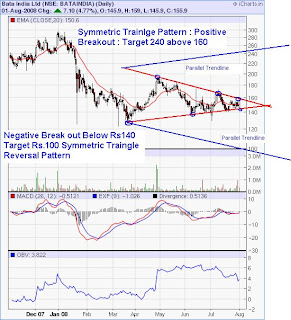
Stock : Bata India
CMP : Rs 157
Breakout above : 160
Target : 200-240
Time Frame : 2-3 Months
As of Now Bata India Stock Showing Positive Signs for the formation of Traingle Breakout for a price target
of Rs200- 240 in short span of time say 2-3 months with great support lying at 140. If this stock fails to sustain above 140 then once more pattern is possible in Bata India i.e If this stock is not able to sustain above 140 then there is a Chance of formation of Symmetric Traingle Breakdown Patterns in Bata India with a price target of 100
Almost all the Tech Indicators are showing positive and bullish sign as of now and likely to have a positve breaout
above 160. So try to accumulate this stock with stop loss near or just below 140. Also this stock has been recommended to our smsgupshup members at Rs 153.
Characteristics of Symmetrical Traingle Patterns
Extracted from : StockCharts
The symmetrical triangle, which can also be referred to as a coil, usually forms during a trend as a continuation pattern. The pattern contains at least two lower highs and two higher lows. When these points are connected, the lines converge as they are extended and the symmetrical triangle takes shape. You could also think of it as a contracting wedge, wide at the beginning and narrowing over time.
While there are instances when symmetrical triangles mark important trend reversals, they more often mark a continuation of the current trend. Regardless of the nature of the pattern, continuation or reversal, the direction of the next major move can only be determined after a valid breakout.
-
Trend: In order to qualify as a continuation pattern, an established trend should exist. The trend should be at least a few months old and the symmetrical triangle marks a consolidation period before continuing after the breakout.
-
Four (4) Points: At least 2 points are required to form a trend line and 2 trend lines are required to form a symmetrical triangle. Therefore, a minimum of 4 points are required to begin considering a formation as a symmetrical triangle. The second high (2) should be lower than the first (1) and the upper line should slope down. The second low (2) should be higher than the first (1) and the lower line should slope up. Ideally, the pattern will form with 6 points (3 on each side) before a breakout occurs.
-
Volume: As the symmetrical triangle extends and the trading range contracts, volume should start to diminish. This refers to the quiet before the storm, or the tightening consolidation before the breakout.
-
Duration: The symmetrical triangle can extend for a few weeks or many months. If the pattern is less than 3 weeks, it is usually considered a pennant. Typically, the time duration is about 3 months.
-
Breakout Time Frame: The ideal breakout point occurs 1/2 to 3/4 of the way through the pattern's development or time-span. The time-span of the pattern can be measured from the apex (convergence of upper and lower lines) back to the beginning of the lower trend line (base). A break before the 1/2 way point might be premature and a break too close to the apex may be insignificant. After all, as the apex approaches, a breakout must occur sometime.
-
Breakout Direction: The future direction of the breakout can only be determined after the break has occurred. Sound obvious enough, but attempting to guess the direction of the breakout can be dangerous. Even though a continuation pattern is supposed to breakout in the direction of the long-term trend, this is not always the case.
-
Breakout Confirmation: For a break to be considered valid, it should be on a closing basis. Some traders apply a price (3% break) or time (sustained for 3 days) filter to confirm validity. The breakout should occur with an expansion in volume, especially on upside breakouts.
-
Return to Apex: After the breakout (up or down), the apex can turn into future support or resistance. The price sometimes returns to the apex or a support/resistance level around the breakout before resuming in the direction of the breakout.
-
Price Target: There are two methods to estimate the extent of the move after the breakout. First, the widest distance of the symmetrical triangle can be measured and applied to the breakout point. Second, a trend line can be drawn parallel to the pattern's trend line that slopes (up or down) in the direction of the break. The extension of this line will mark a potential breakout target.
Iam very Eager to see about the breakout in this stock. Your views about this stock and the pattern here are
welcome.
Regards,
Rajandran R
Author – MarketCalls
