Rajandran R FollowCreator of OpenAlgo - OpenSource Algo Trading framework for Indian Traders. Telecom Engineer turned Full-time Derivative Trader. Mostly Trading Nifty, Banknifty, High Liquid Stock Derivatives. Trading the Markets Since 2006 onwards. Using Market Profile and Orderflow for more than a decade. Designed and published 100+ open source trading systems on various trading tools. Strongly believe that market understanding and robust trading frameworks are the key to the trading success. Building Algo Platforms, Writing about Markets, Trading System Design, Market Sentiment, Trading Softwares & Trading Nuances since 2007 onwards. Author of Marketcalls.in
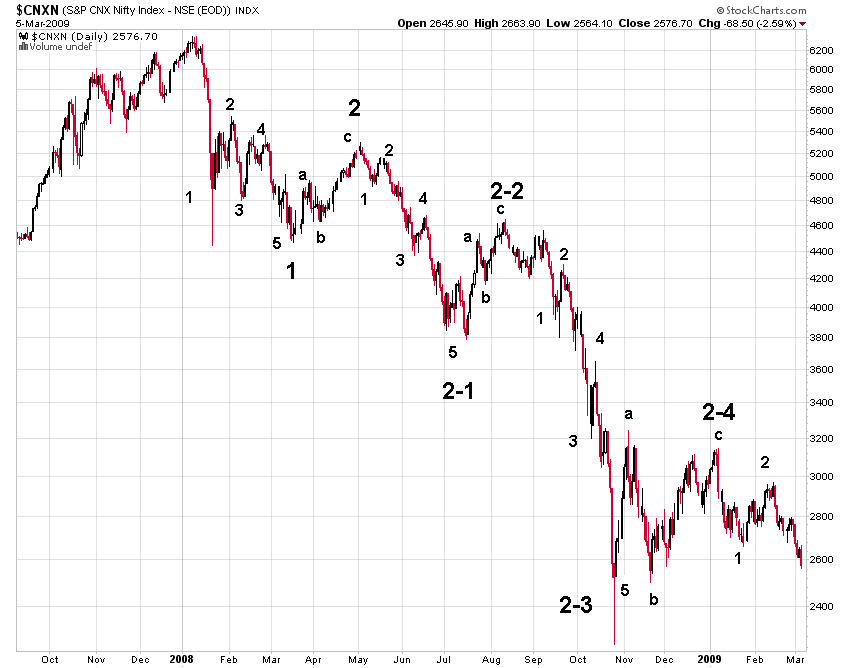
Visible Elliot Wave Count from Nifty Daily charts
13 sec read
[wp_ad_camp_5]
Daily wave shows we are in the progress of making 2-4-3 downwave. Possibly this wave could end near 2362 which is 161.8% of downward retracement between the 3147-2662(i.e 161.8% of retracement from the 2-4-1 wave).
Just for Readings For those Who intrested in reading Elliot wave patterns.
Rajandran R FollowCreator of OpenAlgo - OpenSource Algo Trading framework for Indian Traders. Telecom Engineer turned Full-time Derivative Trader. Mostly Trading Nifty, Banknifty, High Liquid Stock Derivatives. Trading the Markets Since 2006 onwards. Using Market Profile and Orderflow for more than a decade. Designed and published 100+ open source trading systems on various trading tools. Strongly believe that market understanding and robust trading frameworks are the key to the trading success. Building Algo Platforms, Writing about Markets, Trading System Design, Market Sentiment, Trading Softwares & Trading Nuances since 2007 onwards. Author of Marketcalls.in
In May, the National Oceanic and Atmospheric Administration predicted a near-normal 2019 hurricane season, which runs from June 1 to November 30. But,...
Dear Rajandran,what you have labelled as 2-1, 2-2 ….. should be 3-1, 3-2 and so on these are 3 ka 1 , 3 ka 2 like wise and will end as the 3rd wave.
Yes Nimesh you are right it should be 3-1,3-2,3-3,3-4,3-5 and 3-5 marks the end of 3rd wave…Thanks for your feedback