Rajandran R Creator of OpenAlgo - OpenSource Algo Trading framework for Indian Traders. Telecom Engineer turned Full-time Derivative Trader. Mostly Trading Nifty, Banknifty, High Liquid Stock Derivatives. Trading the Markets Since 2006 onwards. Using Market Profile and Orderflow for more than a decade. Designed and published 100+ open source trading systems on various trading tools. Strongly believe that market understanding and robust trading frameworks are the key to the trading success. Building Algo Platforms, Writing about Markets, Trading System Design, Market Sentiment, Trading Softwares & Trading Nuances since 2007 onwards. Author of Marketcalls.in

Aftermath : Why our Double Money Nifty Call Goes Wrong?

1 min read

 
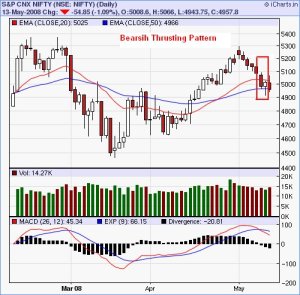
Eventhough 12th,May Wtinessed Strong Positive recovery to 5013 in Nifty. I failed to notice the formation of Bearish Weak Continuation Thrusing Candlestick Pattern.

Nifty CMP : 4957


[wp_ad_camp_5]


Nifty 3 Month Chart

Which we discussed below.
 
 
Bearish Thrusting Japanese Candle Stick Pattern
 
The Thrusting pattern starts by a continuation of the established move. Day two reflects a bullish rally that closes into the body of the previous day, but is not able to trade above the midpoint.

The pattern suggests that sellers have not been weakened by the bull rally and if anything, shorts have simply covered their positions allowing price to rise slightly. Going forward the lack of strength exhibited by buyers would discourage longs to enter the market, and allow the continuation of the downtrend.


Medium Continuation In-Neck
Weak Continuation Thrusting

Because this patterns signal is so weak, analysts will look for confirmation from bearish moves the following day.

The Bearish Thrusting Pattern is very similar, but weaker than the Bullish Harami and Bullish Engulfing reversal patterns. Where the day-two close on the Thrusting pattern closes below the midpoint, Haramis close hits at or above the midpoint, the Engulfing patterns' day-two close reach above day-ones open. Bearish Thrustin vs In Neck and On Neck Continuation Patterns Visually, the bearish Thrusting looks similar to the On Neck and In Neck Patterns as well.


How to identify
 
  1. 1st day is a long black day.
  2. 2nd day is a white day which opens well below the low of the 1st day.
  3. 2nd day closes well into the body of the 1st day, but below the midpoint.

Conclusion : But a bearish Thrusting pattern doesnt meant that We are heading strongly downwards.We are still holding above the trend line 4950. Once If we failed to closed above the 4940-4950 band then we are really heading downwards strongly. Now we are at cautious zone. Let see how market moves from here
Rajandran R Creator of OpenAlgo - OpenSource Algo Trading framework for Indian Traders. Telecom Engineer turned Full-time Derivative Trader. Mostly Trading Nifty, Banknifty, High Liquid Stock Derivatives. Trading the Markets Since 2006 onwards. Using Market Profile and Orderflow for more than a decade. Designed and published 100+ open source trading systems on various trading tools. Strongly believe that market understanding and robust trading frameworks are the key to the trading success. Building Algo Platforms, Writing about Markets, Trading System Design, Market Sentiment, Trading Softwares & Trading Nuances since 2007 onwards. Author of Marketcalls.in

GANN Shorter term update for Nifty as on 15…

  GANN Supports zone near 5005. More weakness below 5005 as next support near 4780. Avoid longs if nifty dips below 5005. Source:...
Rajandran R
5 sec read

Larsen and toubro update

  Trailing Stop Loss Update for Larsen and Tourbo   Cover Shorts and reverse the position if LT closes above 1665. Source: www.marketcalls.in
Rajandran R
6 sec read

JP Associates is getting Weaker

  1)Stock is showing massive MACD divergence 2)Price is currently below 13,34,55 EMA and these levels could act as a resistance in coming sessions. 3)Stop...
Rajandran R
12 sec read

Leave a Reply

Get Notifications, Alerts on Market Updates, Trading Tools, Automation & More