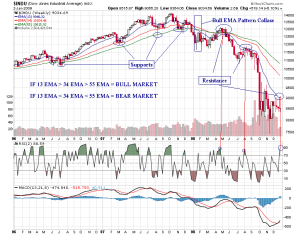
This Post is for those who Believe in Simple EMA Trading System
Before going to the picture EMA Traders will agree a concept that
IF 13 EMA > 34 EMA > 55 EMA THEN = BULL MARKET
IF 13 EMA < 34 EMA < 55 EMA THEN = BEAR MARKET
A BULL MARKET WILL CONVERT INTO BEAR MARKET IF 13 EMA < 34 EMA This is
the first sign of a real Bear Market.
Some Observation
The Above Chart can be divided into three phase
1)BULL PHASE
2)BULL to BEAR TRANSITION PHASE
3)BEAR PHASE
1)During the BULL MARKET EMA's 13, 34 , 55 are acting as a good supports on weekly basis and the pattern 13>34>55 remains steady till the end of BULL PHASE
2)DURING THE TRANSITION PHASE i.e 13 EMA < 34 EMA. Which is the first violation of BULL Market and a warning of BULL to BEAR TRANSITION PHASE
3)AND BEAR MARKET CONFIRMS when 13EMA > 34 EMA > 55 EMA where 13,34,55
will act as a strong resistance this remains steady till BEAR MARKET PHASE
Current Scenario
Normally Supports or Resistance will Hold those resistance levels for a maximum
period of 2-5 Weeks.
Current Scenario Shows that 13 WEEK EMA is acting as a nice resistance for the past
3 Weeks and looks like nifty is in a deep trouble here around this zone.
And My recommendation is to remain short until nifty breaks 3113 Levels.
on closing basis. Any Violation of these supports will lead nifty towards 3250-3300-3500 levels where exactly 21 EMA and 34 EMA could possibly meet the Nifty Weekly Candles.
And for those people who are still having confusion with recent sure in US Markets on 02 JAN 2009. Here is a picture for you….
Chart Shown here is a Weekly DOW CHARTS with oversold RSI Levels
For Clear Picture Click on the chart
There is once again problem for dow with 13 WEEK EMA. Also check out the MASSIVE
Rise in RSI which shows that sell of is clear in one or two days in DOWJONES . Also Earlier too dow respected 13 EMA Resistance as shown in the charts.
Looks Long Term Investors should stay away at this level as the upside looks capped.
CASH is king should be the best strategy at this level.
SAY NO TO NOISE!!!

