Rajandran R FollowCreator of OpenAlgo - OpenSource Algo Trading framework for Indian Traders. Telecom Engineer turned Full-time Derivative Trader. Mostly Trading Nifty, Banknifty, High Liquid Stock Derivatives. Trading the Markets Since 2006 onwards. Using Market Profile and Orderflow for more than a decade. Designed and published 100+ open source trading systems on various trading tools. Strongly believe that market understanding and robust trading frameworks are the key to the trading success. Building Algo Platforms, Writing about Markets, Trading System Design, Market Sentiment, Trading Softwares & Trading Nuances since 2007 onwards. Author of Marketcalls.in
Shorter Term Nifty GANN Update
15 sec read
[wp_ad_camp_5]
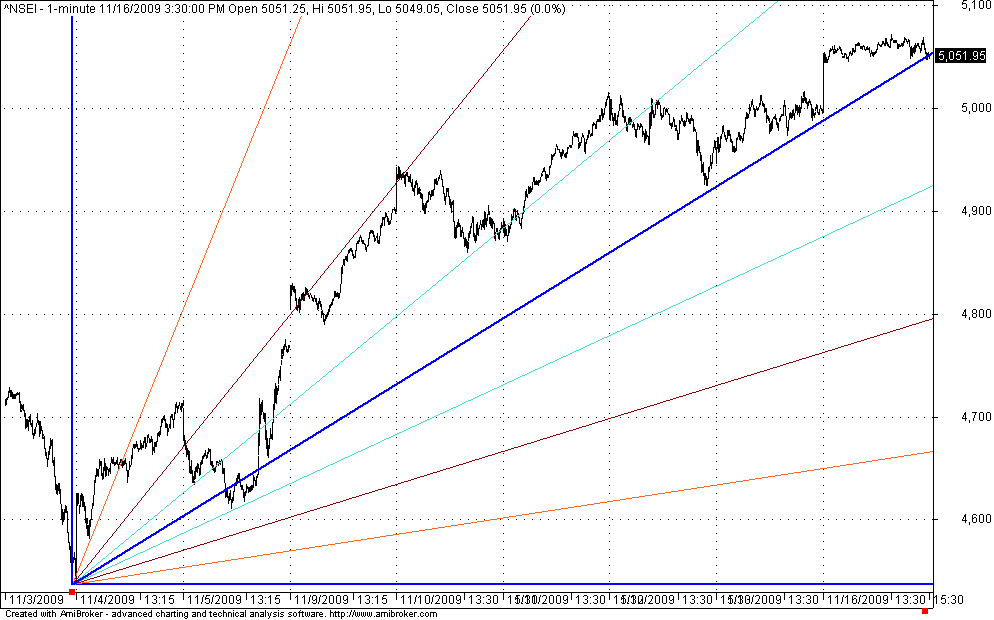
Chart shows 1 minute chart of nifty since the recovery from the Nov 3,2009 lows. Drawing the GANN FANN lines
we could find that 5050 could act as a shorter term trend support. Failure to hold 5050 will induce shorter term weakness in Nifty chart and could target 4940 and 4820 zones.
Overall Nifty Bulls requires sustainability above 5050. Failure will move the market towards the possible 4940 and 4820 shorter term Support zone
Related
Rajandran R FollowCreator of OpenAlgo - OpenSource Algo Trading framework for Indian Traders. Telecom Engineer turned Full-time Derivative Trader. Mostly Trading Nifty, Banknifty, High Liquid Stock Derivatives. Trading the Markets Since 2006 onwards. Using Market Profile and Orderflow for more than a decade. Designed and published 100+ open source trading systems on various trading tools. Strongly believe that market understanding and robust trading frameworks are the key to the trading success. Building Algo Platforms, Writing about Markets, Trading System Design, Market Sentiment, Trading Softwares & Trading Nuances since 2007 onwards. Author of Marketcalls.in
Nifty week end review on daily and 90 min timeframe and Nifty Option Details
5 Replies to “Shorter Term Nifty GANN Update”
from where we can get the charts as you are posting in ur blog.
GM Sir,How are you, thanks for sharing and helping us, Sir one request, I use meta stock and which is the formula to get buy and sell signals like you get in the charts, can you plz share with us the formula and how to input it into the software to get signals not intra in real time but after market hours, just like you inputted in Reliance charts…..Plz share with us sirThanks
@Rajnish KumarCharts are genereated using Amibroker
Sir are you available? plz guide sir need your guidance
Rajandran,if we move the base to recent low of 4538, how the picture will be …is it possible for you to redraw the scenario to get some clues…thankssri